

On this page (9 sections)
Play money only — read this first
This board drops play-money balls only. Nothing here predicts a real drop, results cannot be transferred to any account, and no row count or risk level turns a negative expected value into a positive one. It exists to show you the binomial maths behind the board, not to forecast anything.
Play the simulator
This Plinko simulator drops a ball through a peg board with a chosen row count, lands it in one of the buckets below, and tracks how your observed results compare against the exact binomial probability for each bucket — all in play money.
Pick rows and risk, then drop a ball.
Why the middle hits more than the edges
Every peg the ball touches is one independent, fair coin flip — bounce left or bounce right, each with probability 0.5. After n rows, the bucket the ball lands in is simply the count of 'right' bounces, k, out of n total. The probability of landing in bucket k is the binomial formula:
P(k) = C(n, k) / 2n
where C(n, k) is the number of ways to choose k right-bounces out of n rows. This distribution peaks at the centre bucket and falls off toward both edges, which is exactly the bell shape you'll see the ball favour over many drops in the widget above.
A concrete number
At 16 rows, the centre bucket (8 right-bounces out of 16) has a binomial probability of about 19.6% — nearly one drop in five. The outermost bucket (16 right-bounces out of 16, or 0) has a probability of about 0.0015%, which is roughly one drop in sixty-five thousand. Same board, same fair coin flips, wildly different odds by position.
How the payout table is generated
This simulator does not copy any operator's live paytable. Instead it generates its own, transparently, using a geometric growth formula: a bucket's raw payout weight grows with a fixed multiplier for every step of distance from the centre, with a faster growth rate at higher risk levels.
That raw shape is then normalised so the whole table's expected value matches exactly 1 − edge, where edge is the house-edge input above. In other words: build a shape first, then scale the whole table until the maths balances at your chosen edge. That is the general method any edge-weighted payout table uses, whichever operator built it.
| Risk level | Growth per step from centre | General feel |
|---|---|---|
| Low | ×1.35 per row of distance | Flatter table, small gap between best and worst bucket |
| Medium | ×1.65 per row of distance | Moderate spread, noticeable edge-bucket premium |
| High | ×2.2 per row of distance | Steep spread, edge buckets pay dramatically more, centre pays a fraction of the stake |
Why edge buckets pay big and land almost never
This is the same balancing act every edge-weighted payout table performs. If a bucket is hit only 1 time in 1,000 drops, its payout has to be roughly 1,000 times the average stake just to contribute its fair share to the table's expected value — set the payout any lower and the table's overall edge would be worse than advertised; any higher and the operator would be handing back more than the edge allows.
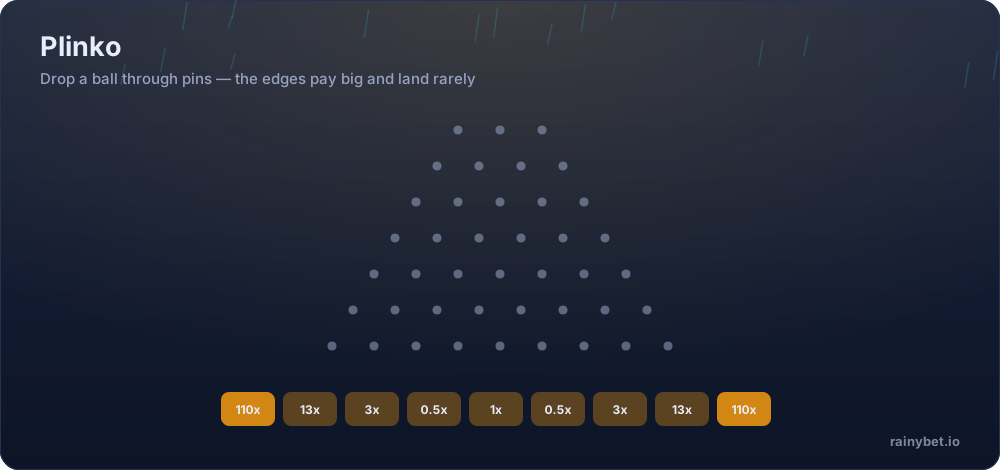
Reading the observed vs. expected table
The table below the board updates after every drop. Expected % is the binomial probability for that bucket, calculated directly from the row count you picked — it never changes based on what you've dropped so far. Observed % is the share of your own drops that actually landed there, and it will bounce around unpredictably at low drop counts before settling closer to the expected column as you drop more balls.
Try this to see convergence directly
Drop one ball, look at the observed column, then click “Drop 200 balls” several times in a row. The observed percentages will move noticeably closer to the expected percentages each time — that convergence is the Law of Large Numbers, not a coincidence.
How to use this without fooling yourself
Four ways to get something real out of a play-money board
- Drop a single ball a few times at 8 rows and note how often it lands near the middle.
Where people trip up: Small row counts converge faster and make the binomial shape easier to see quickly.
- Switch to 16 rows and drop 200 balls at once.
Where people trip up: More rows means more buckets and a slower convergence — the observed column will take longer to settle, which is itself the lesson.
- Compare low risk and high risk at the same row count.
Where people trip up: The bucket probabilities won't move at all; only the payout numbers next to them will change — proof that risk level reshapes reward, not odds.
- Change the house-edge input and re-run the same drops.
Where people trip up: Watching every multiplier in the table shift by the same proportion shows the edge applies uniformly across the whole payout curve, not just to the rare buckets.
Honest pros and cons of practising here
What works about this offer
- Zero financial risk while you learn how a binomial distribution shapes real outcomes
- Live observed-vs-expected table makes convergence visible instead of theoretical
- Risk-level comparison shows plainly that payout shape and odds are separate things
- Fast enough to drop hundreds of balls in the time one real round takes
What to weigh up first
- Payout table is illustrative, not a copy of any specific operator's real paytable
- A lucky short run in the observed column proves nothing about the long-run odds
- Cannot replicate the pull of watching a real balance rise or fall on a big bucket
- Says nothing about a named operator's exact published house edge
Licence, geo-restrictions and playing safely
Licensing. Access is blocked in a number of countries and US states, and the list is maintained by the operator rather than published as a stable document. The current restricted list and licence details live on the operator’s own terms page — read them before you register.
Your side of it. Crypto casinos settle fast, which is exactly what makes them easy to overplay. Before your first deposit at Rainbet, set a deposit cap and a session timer in the account settings — not in your head.
- Deposit limits and self-exclusion tools live in account settings, not support chat
- A losing session is not a signal to raise the stake — it is a signal to stop
- Bonus turnover targets are not a reason to keep playing past your limit
- Free, confidential help: BeGambleAware and Gambling Therapy
Frequently asked questions
Why does a Plinko ball land in the middle most often?
Each peg is an independent 50/50 left-or-right event, and the final bucket is just the count of 'right' bounces out of all the rows. With many independent coin flips, the most common total is close to half of them — which lands you near the middle bucket far more often than either edge.
Why do the edge buckets pay so much if they're so rare?
Binomial probability falls off fast the further a bucket sits from the centre — the edge buckets might be hit a fraction of a percent of the time. To keep the overall expected value at a fixed edge, a payout table has to compensate rare buckets with a large multiplier and common buckets with a small one, or the maths would not balance.
Are the multipliers on this simulator real operator numbers?
No. This simulator generates its own illustrative payout table using a simple geometric formula shown on this page — a payout that grows with distance from the centre, then normalised so the whole table matches your chosen house-edge input. It is not a copy of any specific operator's live paytable — check the game's own info panel for that operator's published figures.
Does the risk setting change the underlying probability of landing in each bucket?
No. The probability of landing in each bucket is pure binomial maths, driven only by the number of rows — risk level never touches it. What risk level changes is the payout multiplier assigned to each bucket: low risk flattens the table, high risk makes the edge buckets pay far more and the centre pay far less.
What does 'observed vs expected' actually compare?
Expected is the binomial probability for each bucket, calculated directly from the row count. Observed is the running percentage of your own simulated drops that actually landed in each bucket. Drop a handful of balls and the two columns can look quite different; drop hundreds and they converge.
Does more rows mean more variance?
Generally, yes — more rows means more buckets, a wider spread between the edges and the centre, and typically a bigger gap between the biggest and smallest payout on the table, even after the same house edge is applied.
Can I use the risk setting to find a bucket that beats the house edge?
No. Every risk level in this simulator is normalised to the same overall expected value at your chosen edge input — none of them, and no individual bucket within them, carries a positive expectation.